+1 931-891-8925

Hey there, marketing aficionado! Have you ever felt like you’re navigating through an endless sea of data, trying to make sense of it all? You’re not alone. Marketing reports are your trusty compass, guiding you to make well-informed decisions based on solid data. They help you see what’s working, what’s not, and where you should focus your efforts next.
Marketing reports come in many shapes and sizes, each tailored to specific needs. Some of the most common types you’ll encounter include:
These reports cover all digital campaigns, such as email marketing, PPC, and social media ads. They focus on metrics like traffic, engagement, conversion rates, and ROI. Tools like Google Analytics and SEMrush are indispensable for compiling these reports.
SEO reports help you understand how well your website is performing in search engines. They include data on keyword rankings, organic traffic, and backlink profiles. With SEO being a long-term strategy, these reports are vital for tracking progress and making necessary adjustments.
As social platforms evolve, these reports show how your social media efforts are paying off. They cover metrics such as follower growth, engagement rates, and social shares. Tools like Hootsuite and Sprout Social can streamline the creation of these reports.
A marketing report is only as good as the data it presents. Here are the essential components you should include:
The foundation of any marketing report is accurate, timely data. Collect data from various sources, such as your website, social media platforms, and email campaigns. Use analytics tools to sift through this data and identify key trends and insights.
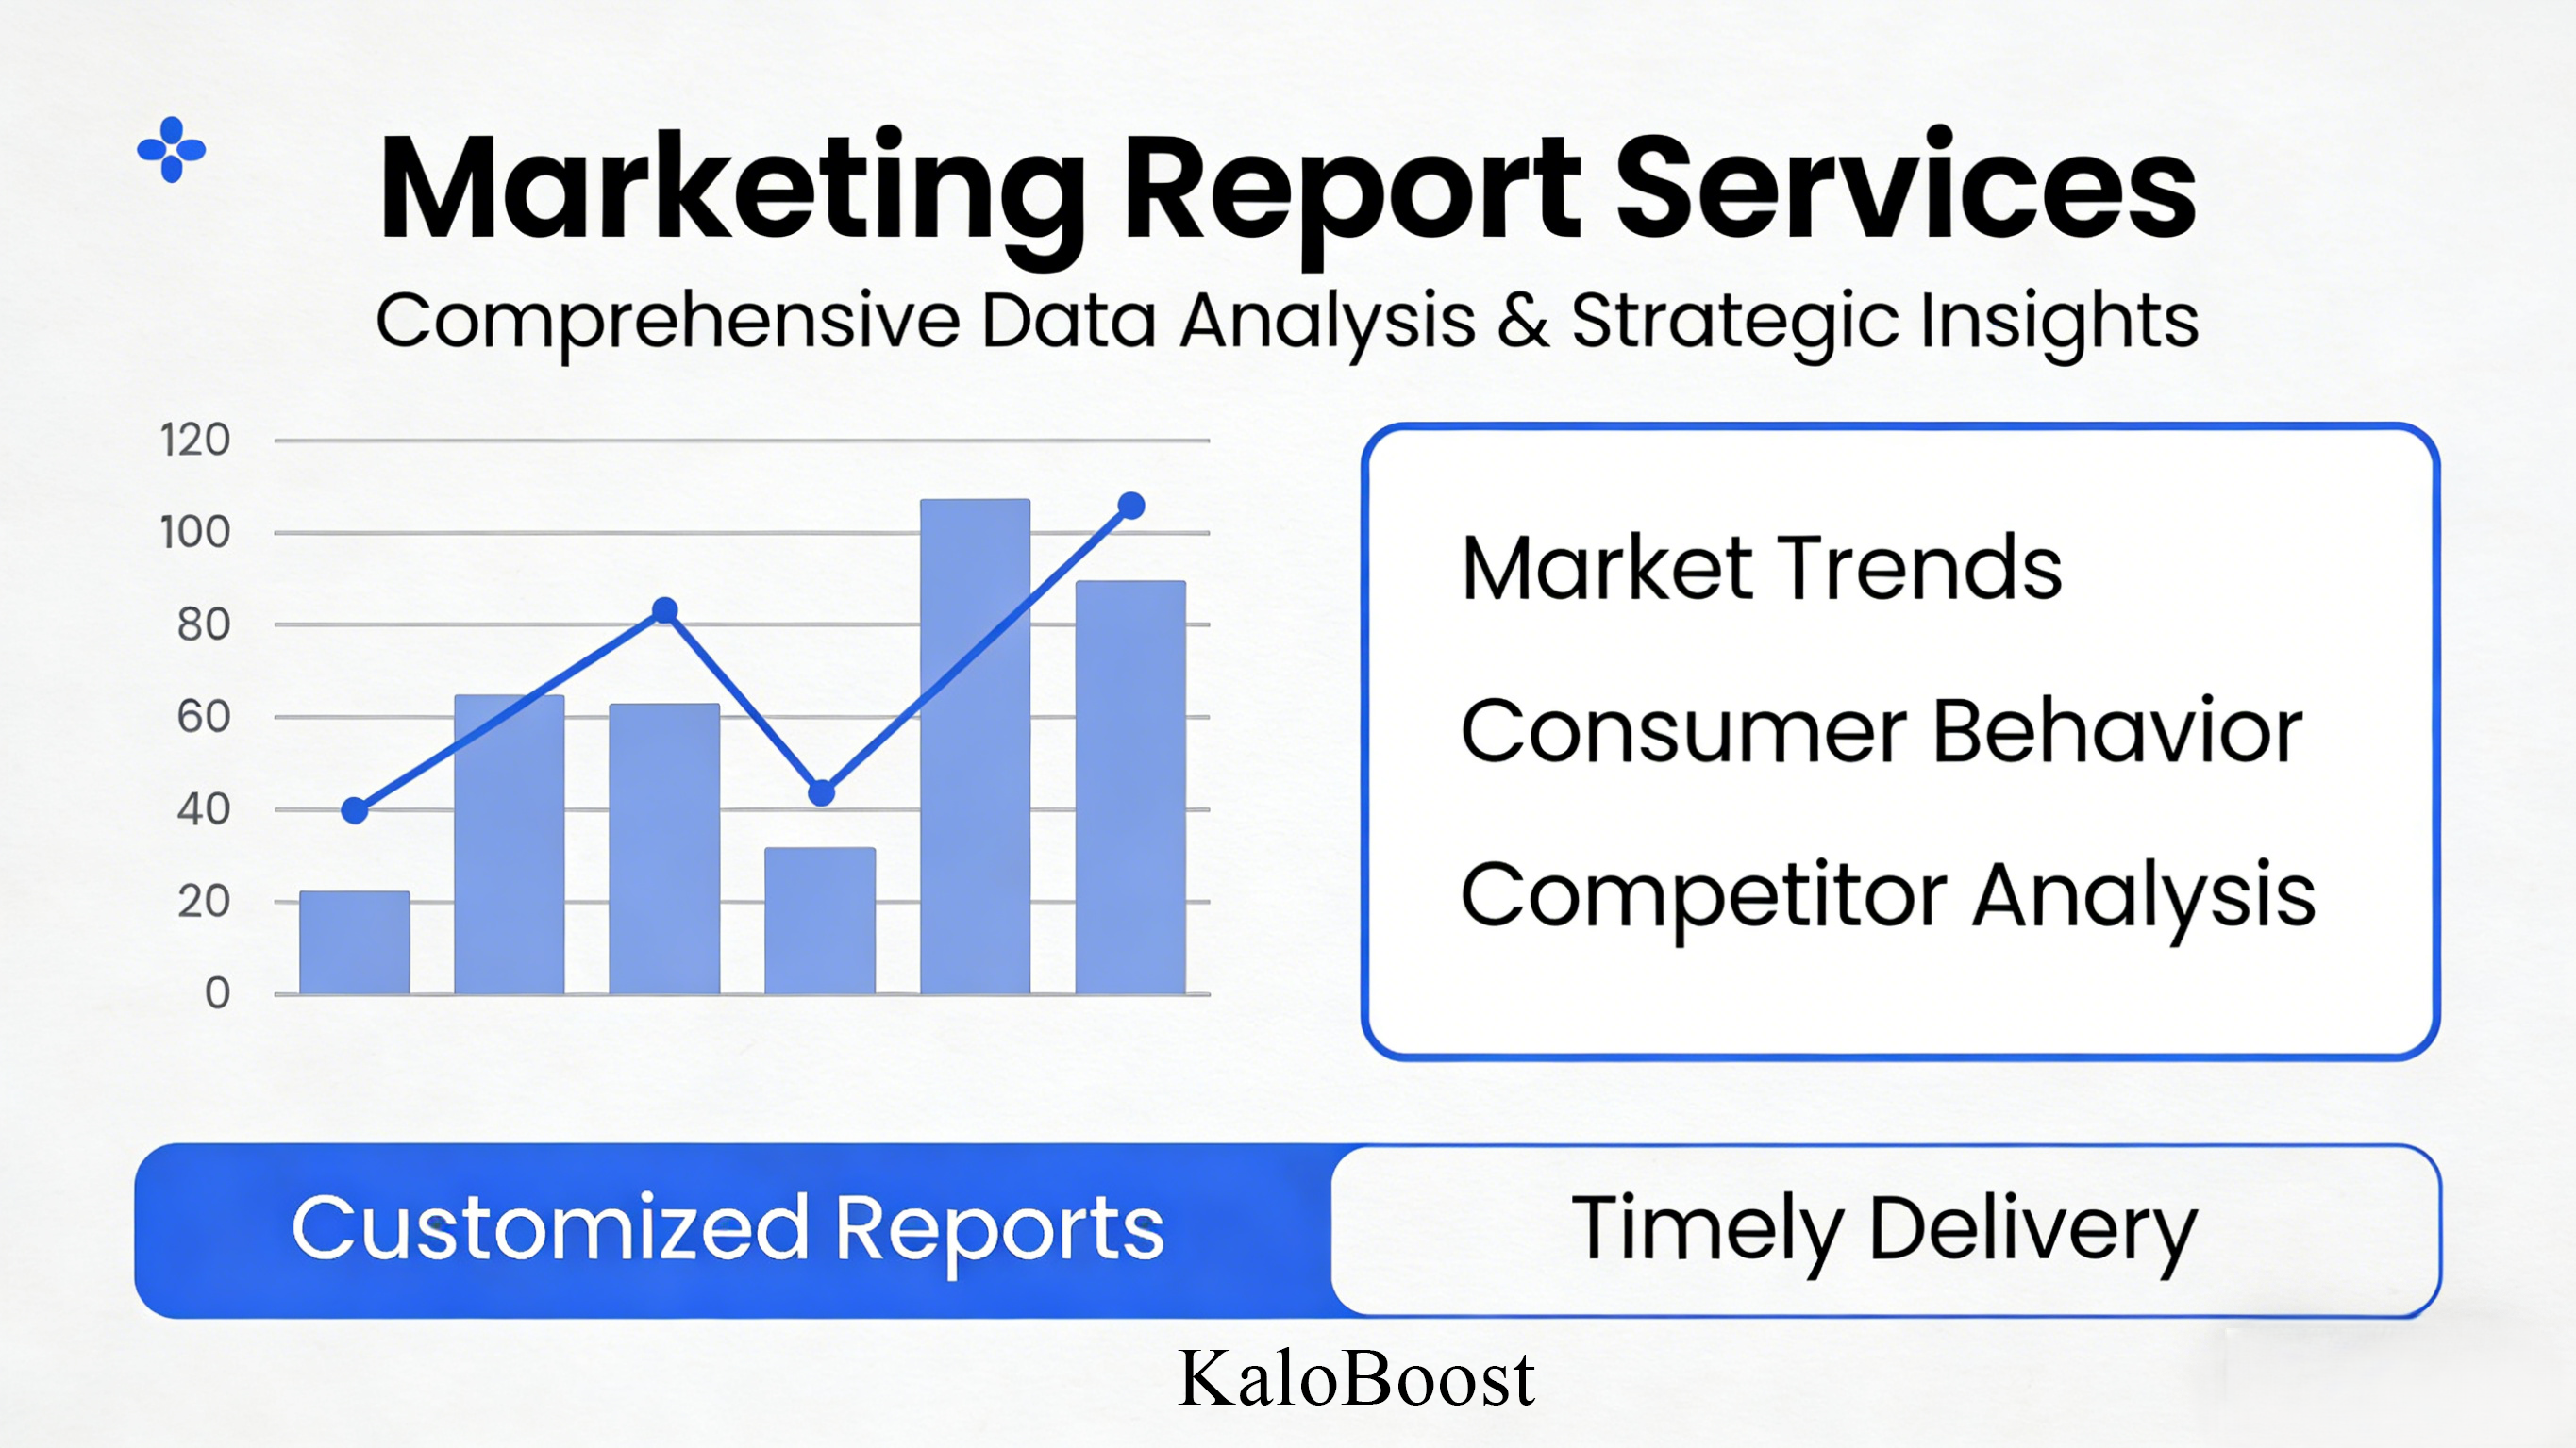
Data is useless if it’s not presented well. Use visualization techniques to make your data pop. Graphs, charts, and infographics can help stakeholders understand your metrics at a glance. Tools like Microsoft Power BI and Tableau are great for creating visually appealing reports.
In 2025, several tools can help you compile and analyze your marketing data efficiently. Here are some must-haves:
Google Analytics remains a powerhouse for tracking website performance. It provides detailed insights into user behavior, traffic sources, and conversion rates.
SEMrush is an all-in-one marketing tool that offers extensive data on SEO, PPC, social media, and content marketing.
For advanced data visualization, Power BI helps you turn complex data into easy-to-understand visuals. It’s perfect for creating comprehensive dashboards and reports.